


SUI Rally At Risk? Analysts Warn Of 30% Dip If This Level Doesn’t Hold

Reason to trust
Strict editorial policy that focuses on accuracy, relevance, and impartiality
Created by industry experts and meticulously reviewed
The highest standards in reporting and publishing
Strict editorial policy that focuses on accuracy, relevance, and impartiality
Morbi pretium leo et nisl aliquam mollis. Quisque arcu lorem, ultricies quis pellentesque nec, ullamcorper eu odio.
SUI, one of the leading altcoins of this cycle, has recorded an impressive price recovery over the past two months. However, as the cryptocurrency fails to hold some key levels, some analysts warn of a potential drop below the $3.00 support.
Related Reading
SUI Rally Risks Massive Price Drop
Since hitting its four-month high of $4.29, SUI’s price has been moving sideways, hovering between $3.40-$4.00 throughout most of May. Amid last week’s market retrace, the altcoin recorded a 14.2% price drop, losing its range and hitting the $3.00 support over the weekend.
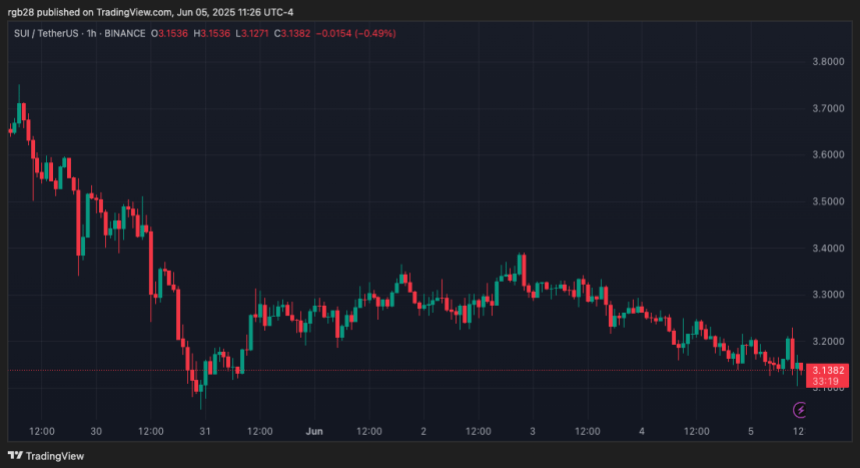
At the start of this week, SUI saw a mild recovery alongside the rest of the market, surging to the $3.20 area. Nonetheless, the cryptocurrency has failed to hold this level over the past 24 hours and dropped to the $3.10-$3.15 area on Thursday morning.
Crypto analyst Carl Runefelt warned that the cryptocurrency’s rally could be in danger as it risks breaking down of a descending triangle pattern.
Per the post, the altcoin has been trading within this formation for the past month, also displaying a potential Head & Shoulders setup forming inside of the triangle, and the pattern’s baseline sitting around the $3.10 support.
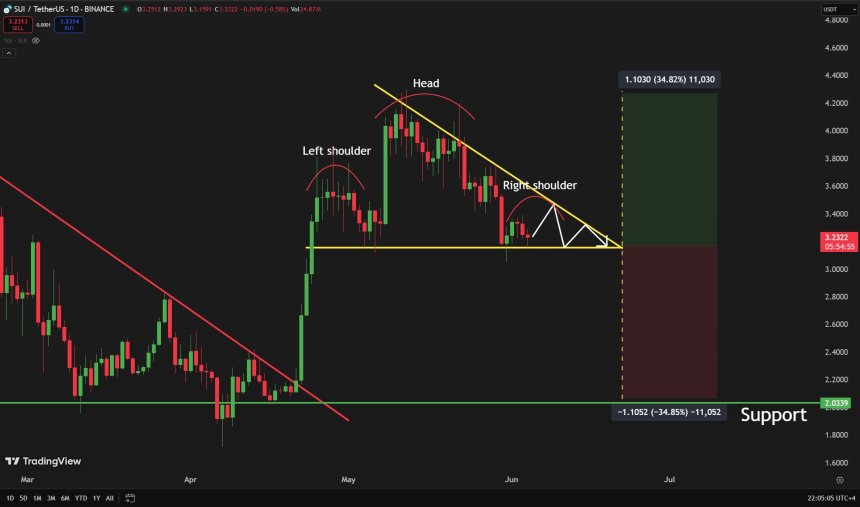
To the analyst, “if it breaks out of this triangle to the downside, then the fall can be very hard,” forecasting a nearly 35% retrace toward the $2.00 mark. On the contrary, a breakout to the upside could propel SUI’s price toward the $4.20 resistance.
Analyst Crypto Bullet recently highlighted a “humongous” rising wedge pattern in the cryptocurrency’s chart, which eyes the $8-$10 area as the next major target. According to the chart, SUI has been moving within this pattern since early 2024, hovering between the upper and lower boundaries for over a year.
Notably, the cryptocurrency hit the support trendline one more time during the April low, bouncing from this level. Based on this, the analyst considers that the current dip could be “the last opportunity to add to your bags before SUI makes a new ATH.”
Can It Repeat Its Late 2024 Playbook?
Analyst Rekt Capital noted that SUI was positioned for a bullish Monthly Candle Close in May, aiming to replicate its late 2024 performance. Last year, the cryptocurrency retested the $3.39 level and turned it into support, which acted as a springboard toward its January 2025 all-time high (ATH) of $5.35.
This time, May closed below this crucial level, failing to confirm it as support and losing the recent price range. SUI is now “showcasing very early signs of upside wicking into said level to turn it into new resistance.”
The analyst warned that June could see the cryptocurrency reject from this level “if things don’t change over the course of this month.” SUI is currently located inside the $2.33-$3.39 price range and is trying to position itself for a reclaim of the Range High to facilitate a breakout.
However, it has unsuccessfully attempted to surge to that level, which could send the price toward lower levels if it “continues to float here without covering additional ground.”
Related Reading
Therefore, SUI risks dropping 10% toward the $2.81 mid-range area, which acted as support and weak resistance earlier this year, and falling 30% to the $2.33 range low if the previous level doesn’t hold.
“If SUI fails to show signs of reclaiming $3.39 as support (at least on the Daily timeframe via Daily Closes above $3.39), then sub-$3 regions could be on the cards,” the analyst concluded.
As of this writing, SUI trades at $3.08, a 2.3% decline in the daily timeframe.
Featured Image from Unsplash.com, Chart from TradingView.com
[title_words_as_hashtags